In complex systems with many microservices, defining the stage when a request has failed and troubleshooting such issues are difficult.
For easier and more precise troubleshooting of application latency and other issues, CloudBlue Commerce can be integrated with the external distributed tracing system Jaeger.
How to Configure CloudBlue Commerce Integration with an External Tracing System
- Deploy a Kubernetes cluster.
- Install the three Jaeger components (Jaeger collector, Jaeger UI, and Database) on the Kubernetes cluster using a Helm package.
- Install the rpm package
trace-seekeron nodes which must be traced, for example, on a management node, the Billing application node, the UI node, the APS endpoint node (if applicable), and on any node hosting microservices.
The minimum requirements for the following components are:
- Jaeger collector: RAM 1 GB, CPU 1 core.
- Database: RAM 4 GB, CPU 2 cores.
- Jaeger UI: RAM 512 MB, CPU 1 core.
- Log parser: RAM 256 MB, CPU 1 core.
High-Level Architecture of the Solution
To collect data about the request distributed across the application's components, the Correlation Id is required. It is a unique ID of the request that needs to be propagated between the microservices (or services) during the single distributed request lifetime.
The main concepts of the distributed system architecture are:
- Instrumentation for a method entry or exit is performed using application logs.
- Each microservice in the system is responsible for the Correlation Id propagation. If the Correlation Id is not present in the request, it must be generated by the receiving service.
- Each component has an installed log parser responsible for parsing the application logs and sending traces to an OpenTracing distributed tracing system (Jaeger) to be collected and analyzed.
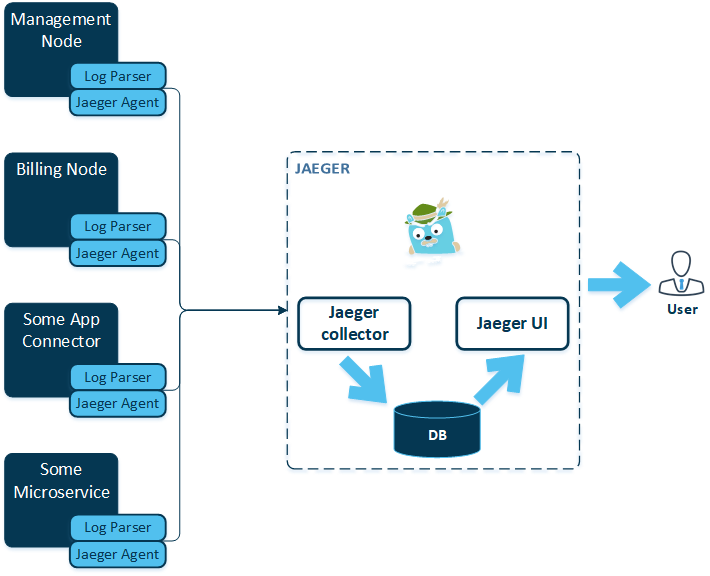
The tracing system consists of several components that can be divided into two groups:
- The Infrastructure group collects the incoming traces from different applications and stores them in general purpose storage from where they will be later retrieved using front end or API requests. In this group, we use CNCF Jaeger distributed tracing system. It includes the Jaeger collector, which writes to the persistent storage back end (ElasticSearch or Cassandra), and the Jaeger query (Rest API) component coupled with the ReactJS based front end.
- The Transport group is responsible for delivering application traces to infrastructure to be collected and analyzed. It consists of the Ingram Micro custom log parser and the Jaeger agent daemon. The log parser is implemented for different log formats (core.log, billing, skeleton, and so on). It parses logs then transforms them to OpenTracing compatible representation and sends to the Jaeger agent daemon. The Jaeger agent daemon sends traces to the Jaeger collector, as the first endpoint of the infrastructure.
Typical Workflow
A typical workflow looks as follows:
- Trace log parsers listen to changes in log files using the unix-like tail approach, find tracing messages (method entry and exit log lines), transform them to OpenTracing compatible representation, and propagate them to the Jaeger agent daemon.
- The Jaeger agent daemon receives traces and routes them to the Jaeger collector service.
- The Jaeger collector service receives traces from different services, aggregates them using the propagated Correlation Id, and stores them in persistent storage.
- The stored traces are available for investigation in the Jaeger UI component or using REST API.