Hardware Requirements
For hardware requirements for the Zabbix server host (CentOS or RHEL 7), please see Zabbix documentation. Only VM-based deployment is supported; on-premise Kubernetes-based deployment is not available.
Deployment
To deploy CloudBlue Commerce Monitoring Suite, perform the following steps:
- Prepare a CentOS or RHEL 7 host for the Zabbix server.
- Install the necessary rpm package to CloudBlue Commerce management nodes, UI nodes, and to the Zabbix host:
- Connect to a node as root using SSH.
- Download the rpm package from https://download.platform.cloudblue.com/oams/oa-zabbix-integration-1.1-11.rpm.
Install the downloaded package:
yum install oa-zabbix-integration-1.1-11.rpm
-
On each UI node, provide connection information that will be used to get metrics from control panels. In the
/usr/local/pem/monitoring/monitoring.inifile, specify the hostname of a brand hosted on the UI node, and a user's credentials. Do this for both the Provider Control Panel and UX1 for Customers.Important: Passwords of the users that will be used for monitoring purposes must not contain special symbols.
-
Deploy Zabbix server. Connect to the host as root using SSH and run the following command:
sh /usr/local/pem/monitoring/setup-zabbix-server.sh
-
On CloudBlue Commerce management and UI nodes, deploy the Zabbix agent:
sh /usr/local/pem/monitoring/setup-zabbix-agent.sh <zabbix_server_ip_address_or_hostname> <mn_or_ui_server_hostname>
-
Log in to Zabbix using your browser:
- URL: <zabbix_hostname>/zabbix
- Login: Admin
- Password: zabbix
- Add all CloudBlue Commerce management and UI nodes to Zabbix:
- Go to Configuration > Hosts and click Create host.
- Specify a name for the host.
- Select the CloudBlue Commerce group for the host.
- Define Agent interface for the host by specifying its IP address.
Switch to the Templates tab and link templates to the hosts as follows:
- to the UI nodes: JMX and UI Services,
- to the management nodes: JMX, MN Services.
- to one of the management nodes: Business Metrics.
Make sure that the template was added as Linked templates. When finished, click Add.
-
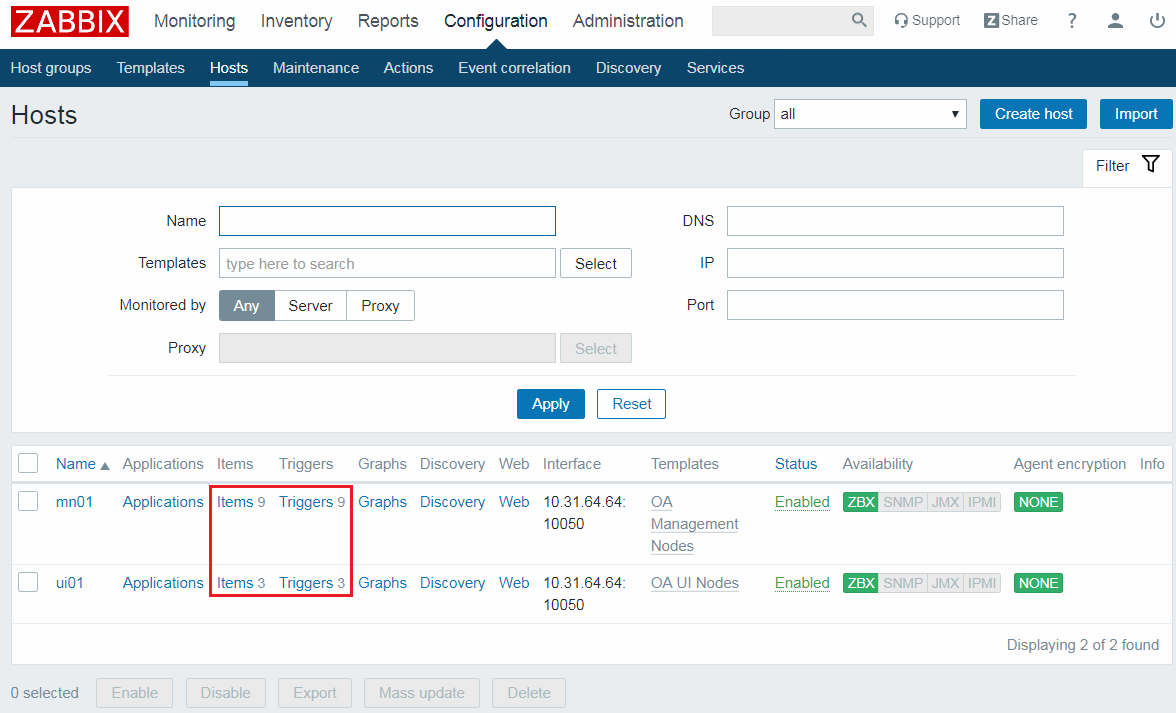
Check that the hosts have been added correctly. Go to Configuration > Hosts and look at the Items and Triggers columns. If both of these values are greater than zero, this means the hosts were added correctly.
- To avoid irrelevant alerts, open the list of Items and disable the ones that are not relevant for your system.
- (Optional) Check that metrics are being checked correctly. Refer to How to check metrics manually for more details.
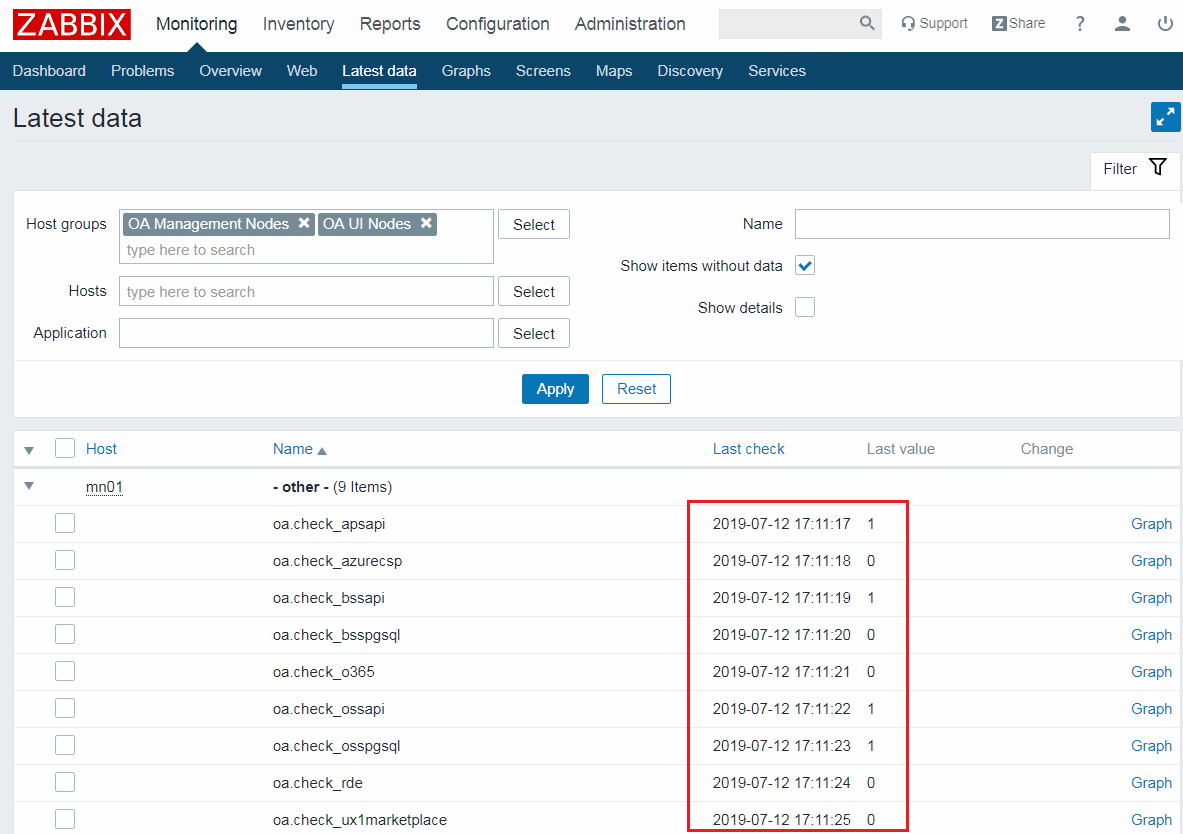
-
To check that the Zabbix server correctly communicates with agents on hosts, go to Monitoring > Latest data and check the data for the CloudBlue Commerce host group. If the data is not empty, then communication is established.