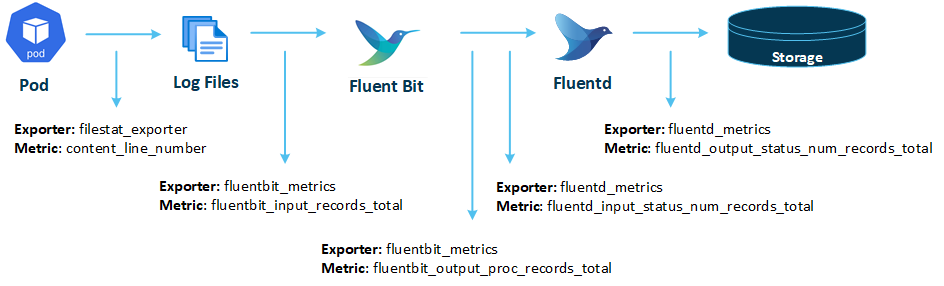
You can monitor the health status of your CloudBlue Commerce logging solution by using the information provided on the Logging Centralized Logs->Fluentbit->Fluent dashboard located in Grafana in the Logging folder.
Key items for you to monitor:
-
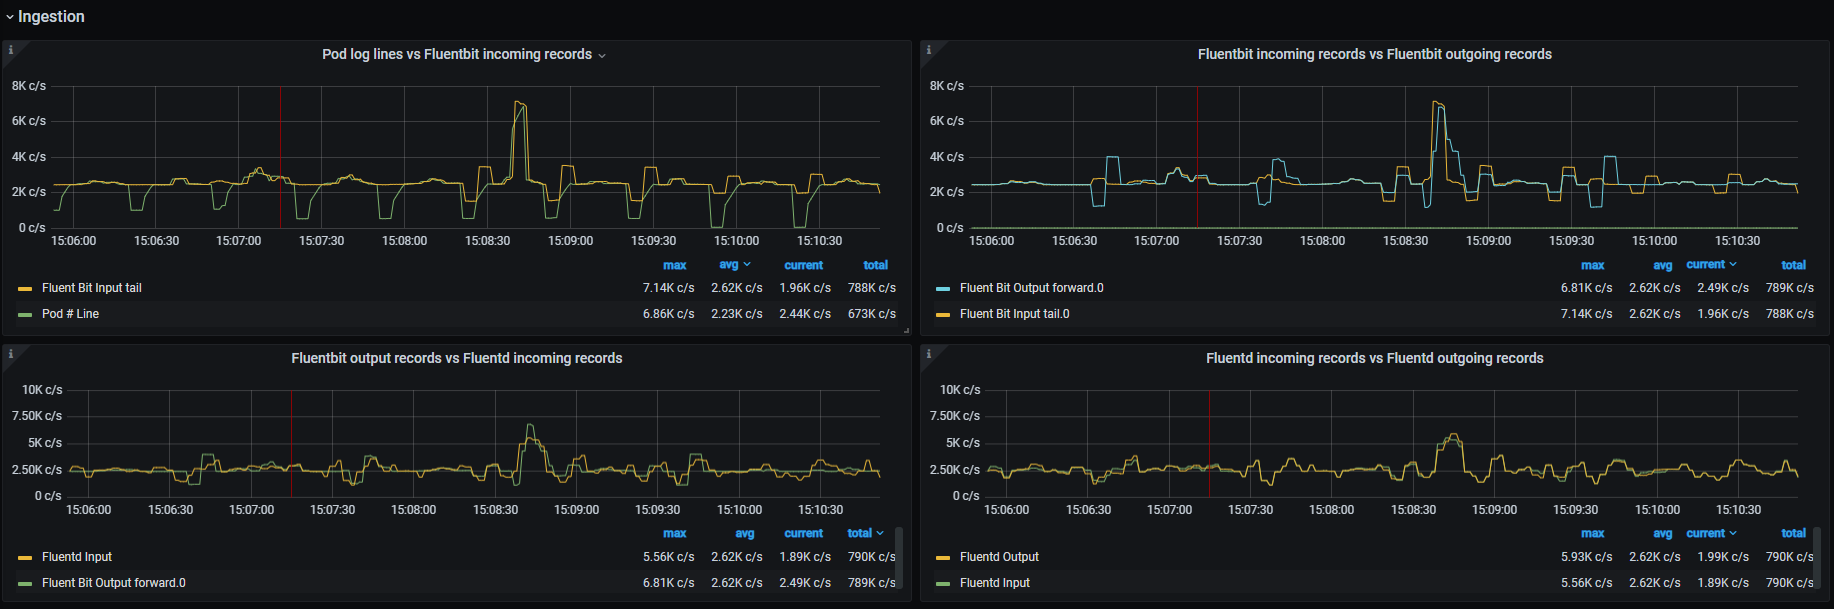
Log records produced by CloudBlue Commerce components compared to log records gathered by Fluent Bit instances
-
Log records gathered by Fluent Bit instances compared to log records sent by Fluent Bit instances to Fluentd instances
-
Log records sent by Fluent Bit instances to Fluentd instances compared to log records received by Fluentd instances
-
Log records received by Fluentd instances compared to log records sent by Fluentd instances to storage
You can view these items on the panels in the Ingestion row. If the lines match, the health status of your logging solution is normal.
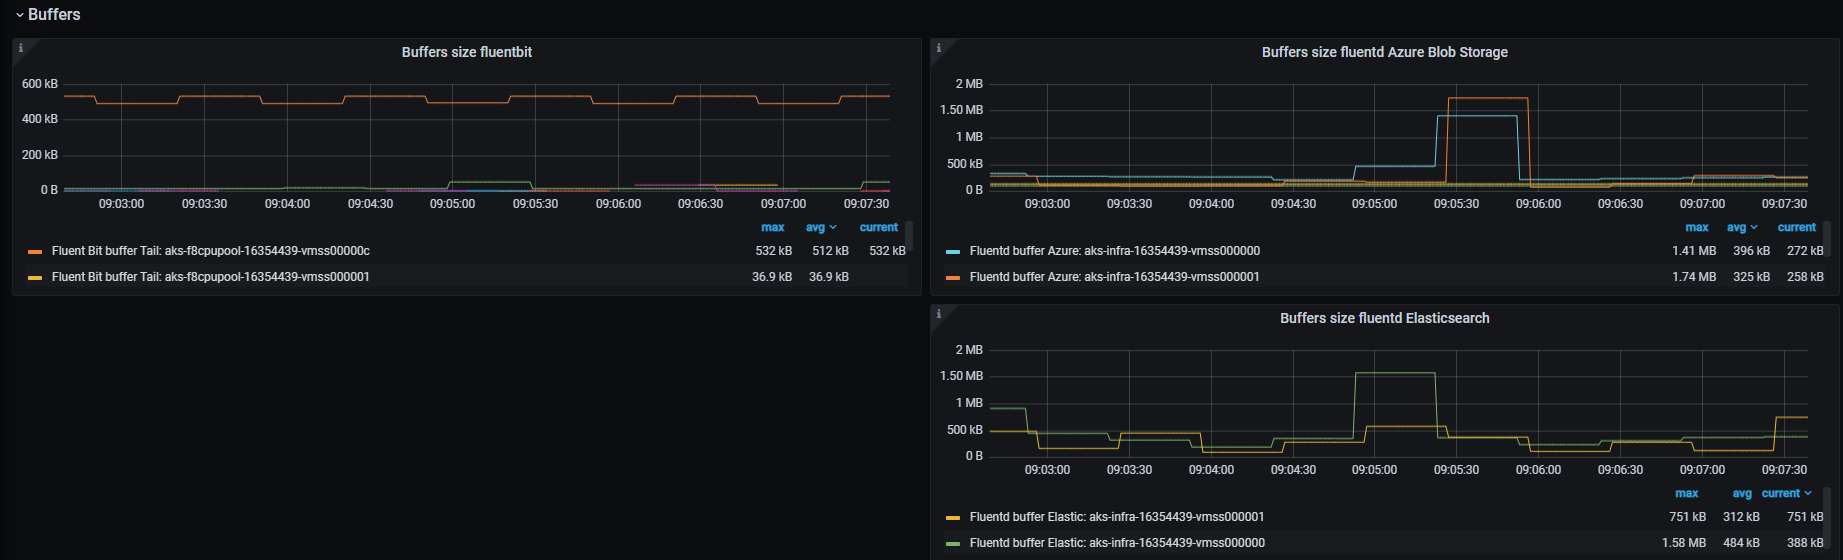
Also, you should check how the sizes of various buffers change over time. You can do this on the panels in the Buffers row.