To monitor CloudBlue Commerce and infrastructure components, use Grafana, which is included in this monitoring and alerting solution.
Dashboards in Grafana are organized in the following way:
-
The folder whose name matches the name of the namespace of your CloudBlue Commerce installation. This folder contains the following dashboards:
-
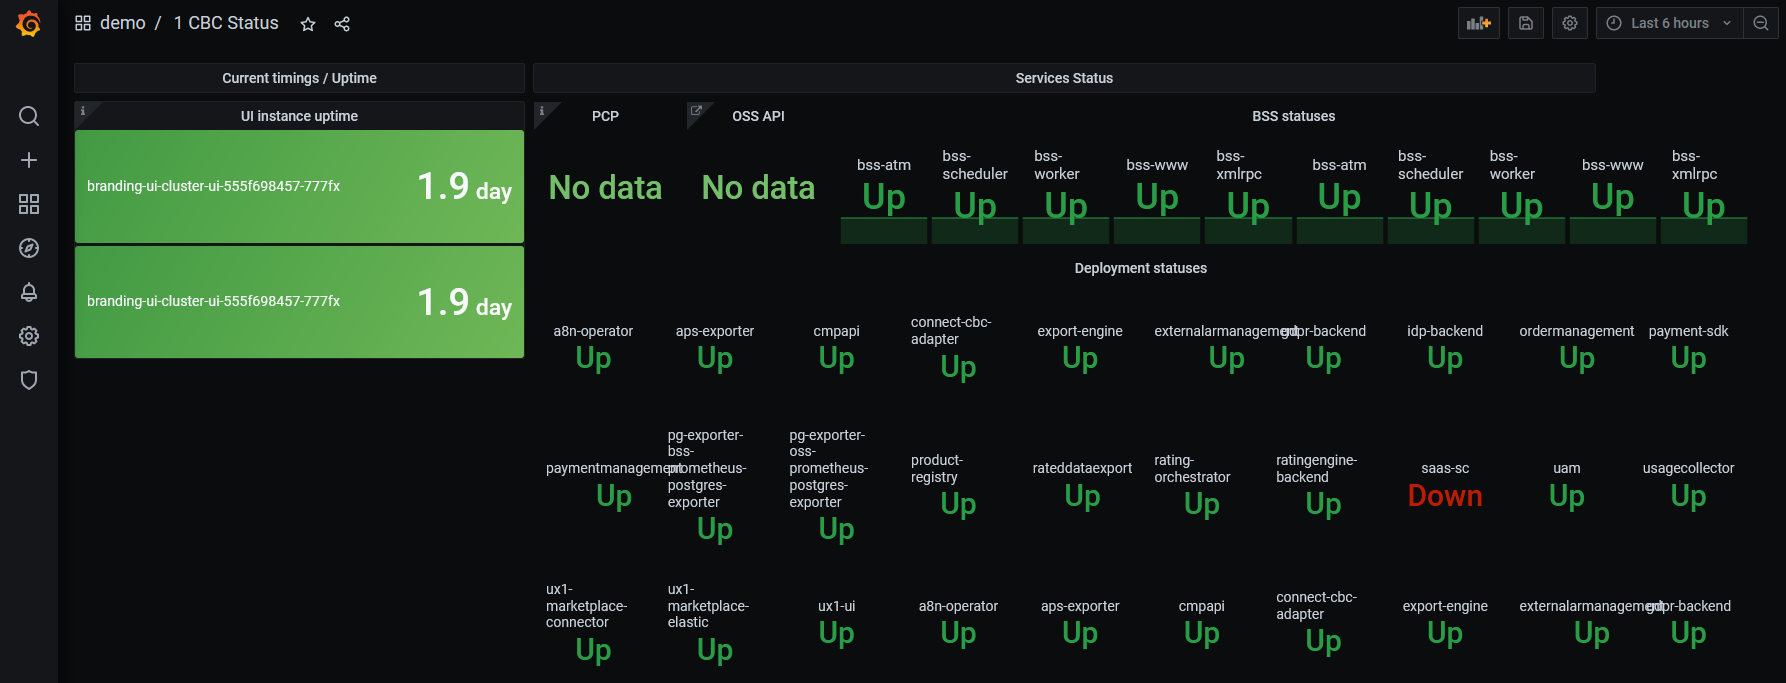
1 CBC Status. This provides liveness status for each CloudBlue Commerce component and contains the history of any outages.
-
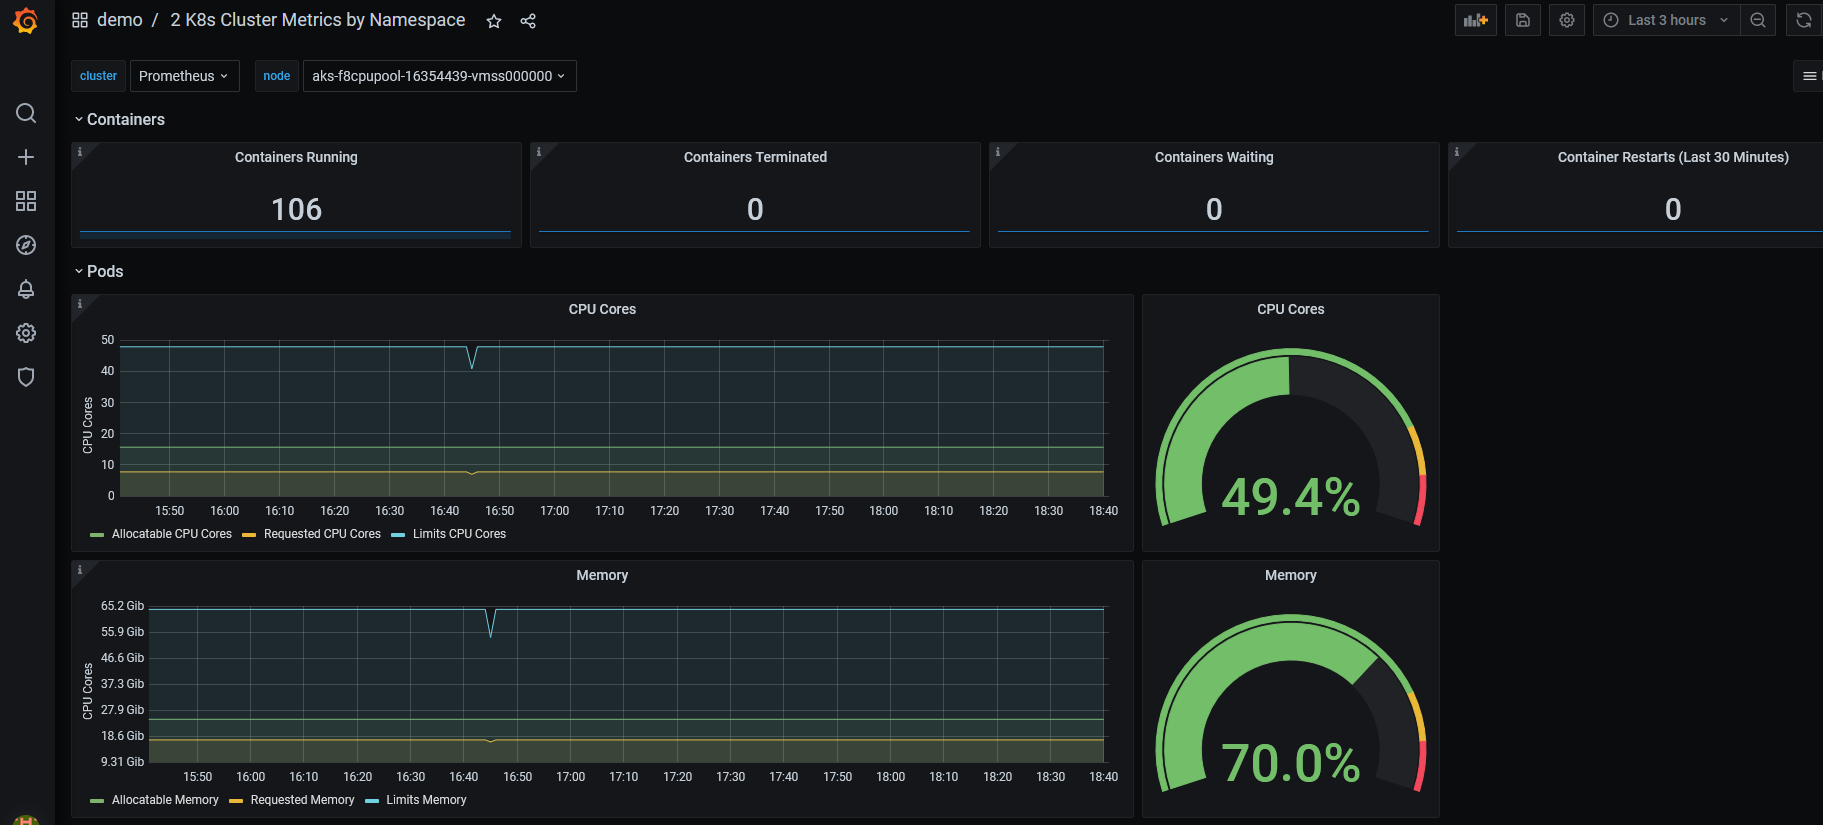
2 K8s Cluster Metrics by Namespace. This provides general statistics about resource allocation and usage.
-
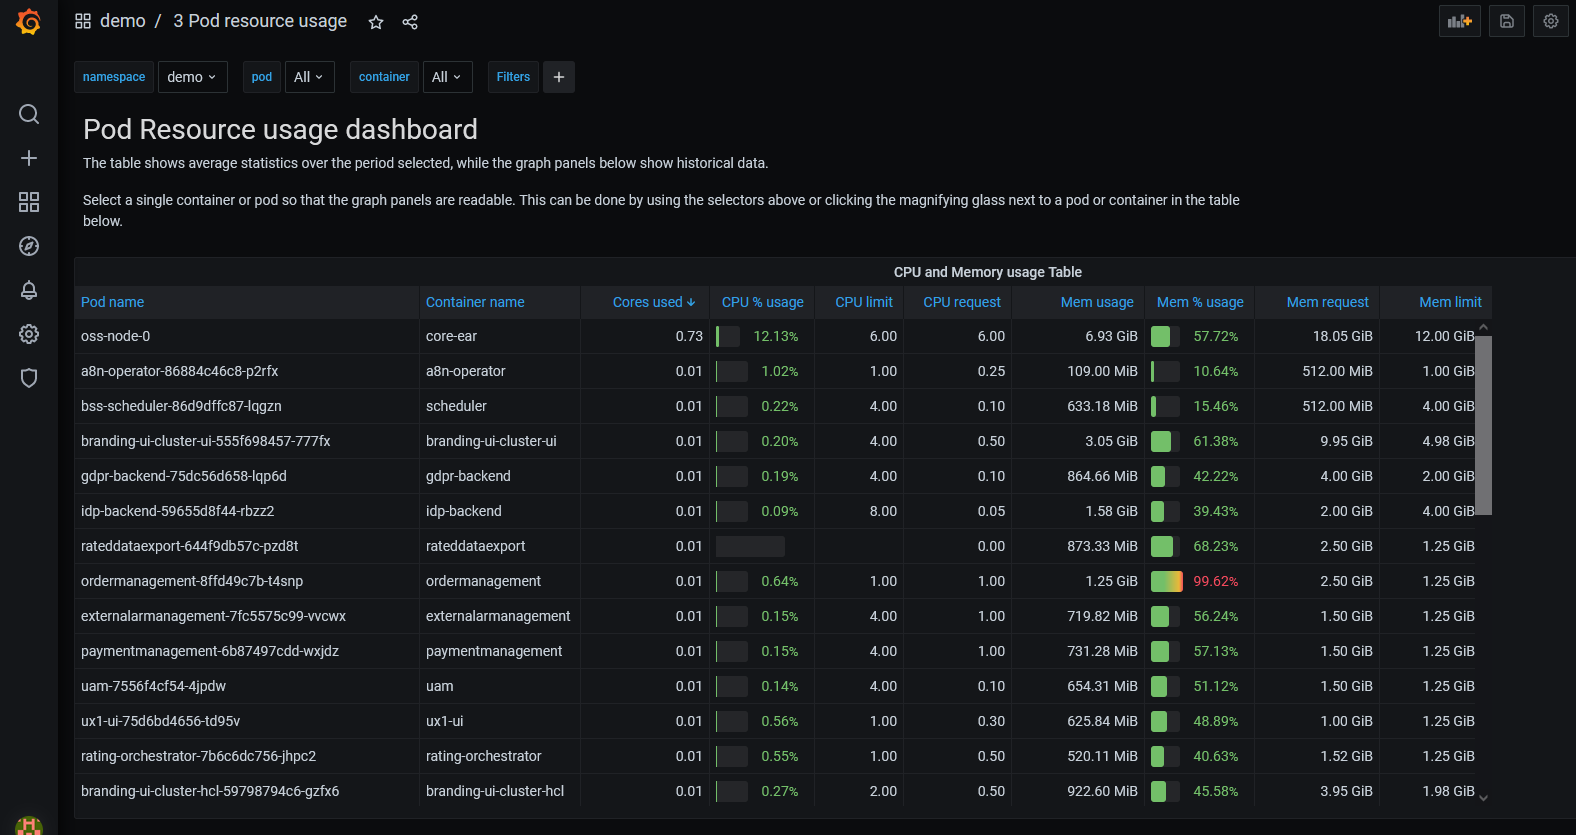
3 Pod Resource Usage. This provides statistics about resource allocation and usage per Pod and per container.
-
Dashboards of CloudBlue Commerce components. These provide component-specific information.
-
-
The General folder. This folder contains dashboards that are included in Grafana by default. These dashboards are useful for monitoring the overall status of your Kubernetes cluster.
An example of the 1 CBC Status dashboard:
An example of the 2 K8s Cluster Metrics by Namespace dashboard:
An example of the 3 Pod Resource Usage dashboard: