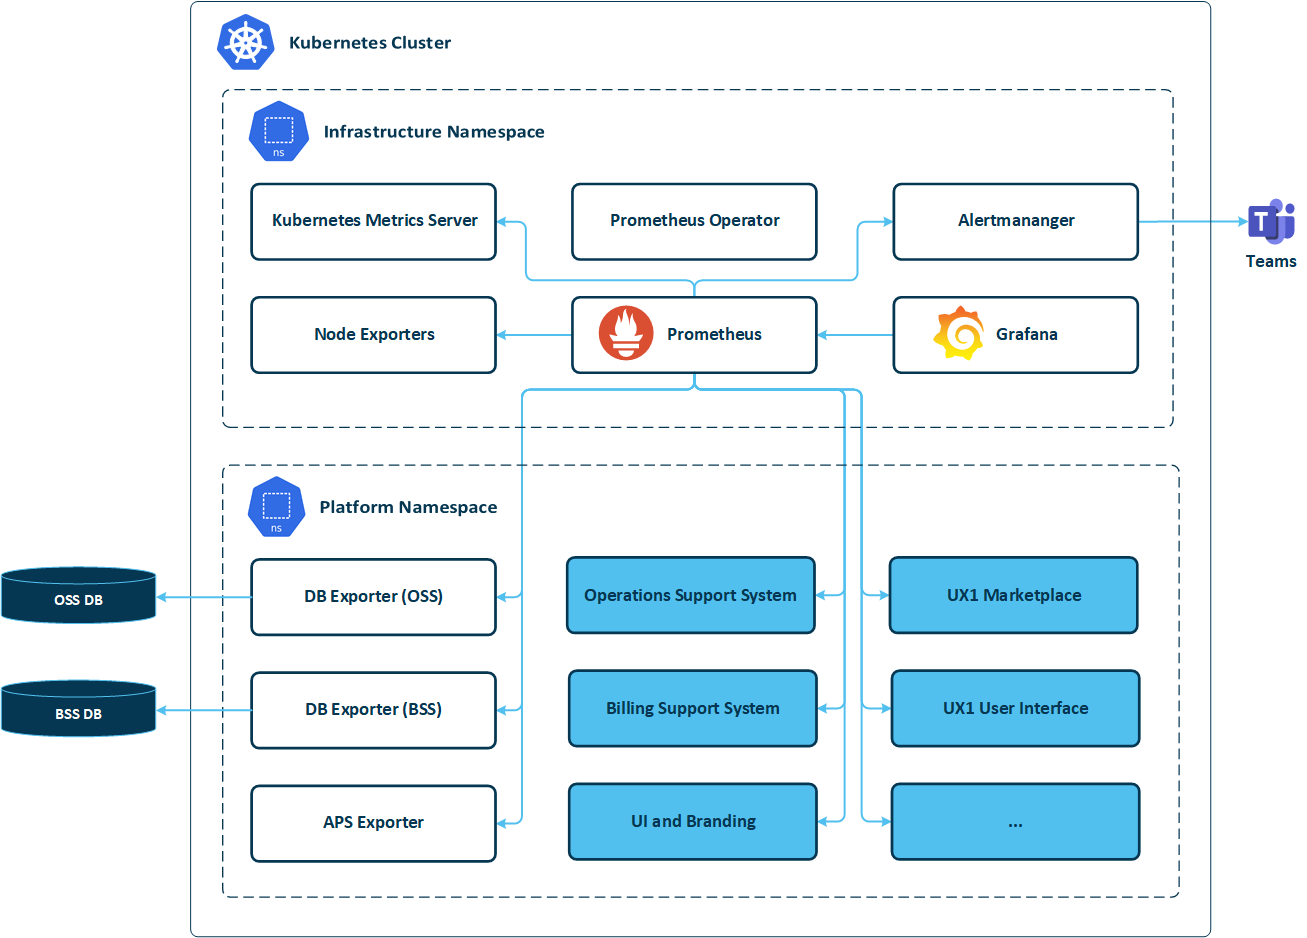
This diagram outlines the architecture of the monitoring and alerting solution.
This solution consists of the following items:
-
Prometheus: It gathers metrics from various sources, stores gathered metrics in its database, provides access to metrics through its API, evaluates alerting rules, and sends alerts to Alertmanager when conditions specified in those alerting rules are met. Metrics are gathered from the following sources:
-
Node exporters
-
The Kubernetes metrics server (kube-state-metrics)
-
The OSS and BSS database exporters, which expose metrics gathered from the OSS and BSS databases
-
The APS exporter, which exposes metrics related to the APS REST API
-
CloudBlue Commerce components, which expose their metrics and are discoverable by Prometheus with special annotations
-
-
Prometheus Operator: It manages the configuration of Prometheus, Alertmanager, and other related components.
-
Alertmanager: It processes and routes alerts sent by Prometheus.
-
Grafana: It visualizes metrics collected by Prometheus.
-
Node exporters: These expose metrics related to Kubernetes cluster nodes.
-
The Kubernetes metrics server (kube-state-metrics): It exposes metrics related to Kubernetes.