Important: This functionality is available for version 21.6 (UI and Branding 21.6-85) or later. If you use version 21.5 or earlier, disable the Application Reporting and Data Export: RDE Charts privilege for the Account Administrator role using a special script.
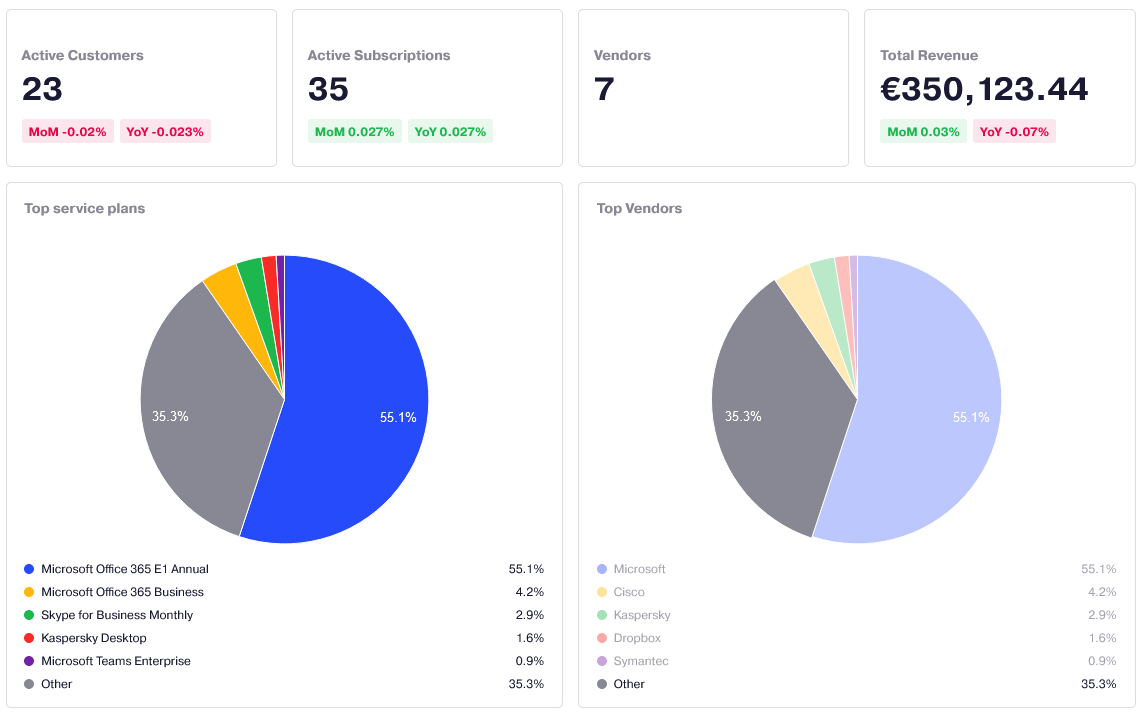
This visualization report displays a number of basic metrics related to the account, such as the number and historical data of active customers, active subscriptions, total revenue of vendors, and its distribution per service plans and vendors.
To access the report, in UX1 go to Analytics, then click Account Overview.

This report includes the following elements:
Active Customers: This unit displays the total number of end-customer accounts with at least one active subscription.*
Active Subscriptions: This unit displays the total number of subscriptions with the Active status.*
Vendors: This unit displays vendors such as Microsoft and Acronis, whose products were resold or bought by the account and all their sub-accounts of all levels.
Total Revenue: This unit displays the whole revenue gained from the account creation time. The revenue is based on the extended price values (the total price with taxes and discounts) from account receivable document details (transactional data).*
Top Service Plans: This chart displays the top five service plans by total revenue, and the other service plans. The revenue includes only invoices.
Top Vendors: This chart displays the top five vendors by total revenue, and the other vendors.
Revenue: This bar chart displays the total revenue per month for the last 12 months.
Active Customers: This bar chart displays the number of end-customer accounts with at least one active subscription per month for the last 12 months.
Active Subscriptions: This bar chart displays the number of subscriptions with the Active status per month for the last 12 months.
* MoM is the comparison of month-over-month values in % for the metric (for example, 22-Apr in comparison with 22-Mar).
YoY is the comparison of year-over-year values in % for the metric (for example, 22-Apr-2022 in comparison with 22-Apr-2021).