CloudBlue Commerce API
Management Node
In this document:
Development Mode
When you test your application on a non-production platform, we recommend that you enable the Development mode, which provides the following benefits:
It disables JavaScript caching (for runtime and packages) on the server side to allow editing of JavaScript files on the fly when debugging UI code.
It removes the restriction that blocks updating an APS package with an updated APS package that has the same application ID and package version; otherwise, you must increase the package release each time you update the APS application.
It adds more details to the system logs on the management node, specifically the APS Controller Log and Platform UI Log.
The APS JS framework detects weaknesses and errors in JavaScript codes and displays respective warnings on the user panel screen as explained in the Development Error Warnings section.
Warning
Do not enable the APS development mode in production because it substantially impacts the network performance, CPU load, and disk usage.
To enable or disable APS development mode:
In the provider control panel, go to System > Settings and follow the System Properties link.
At the bottom of the screen, click Edit.
Select the APS development mode checkbox to enable the APS development mode or clear it to disable this mode.
At the bottom of the screen, click Submit to save the updated configuration.
Task Manager
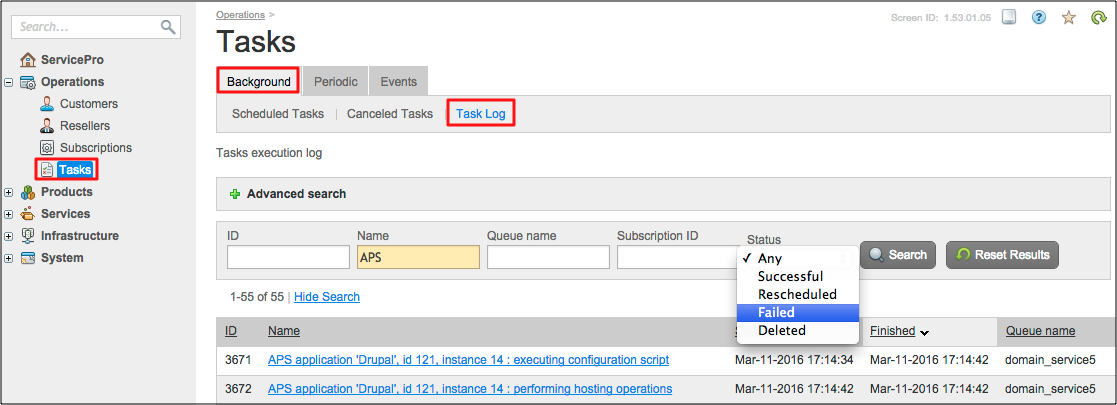
Task manager in the provider control panel (PCP) displays all tasks created in the system including tasks for APS actions. You will find it in the PCP by going to Operations > Tasks.
There are two groups of tasks:
The Background tab displays tasks scheduled asynchronously. The Scheduled Tasks sub-tab shows currently scheduled or failed tasks. On the Task Log sub-tab, you will see the other completed tasks.
When provisioning or unprovisioning a subscription that contains APS resources, the system creates three tasks:
Initiating operation. This operation changes the status of the involved resource from
aps:readyto another status.Provisioning or Unprovisioning. The APS controller interacts with the application endpoint to process the required requests, for example, to add or remove a resource.
Finalizing operation. This operation commits all necessary changes in the APS database: resource links, properties, and usage in the subscription are updated. If successful, it returns the resource status to
aps:ready.
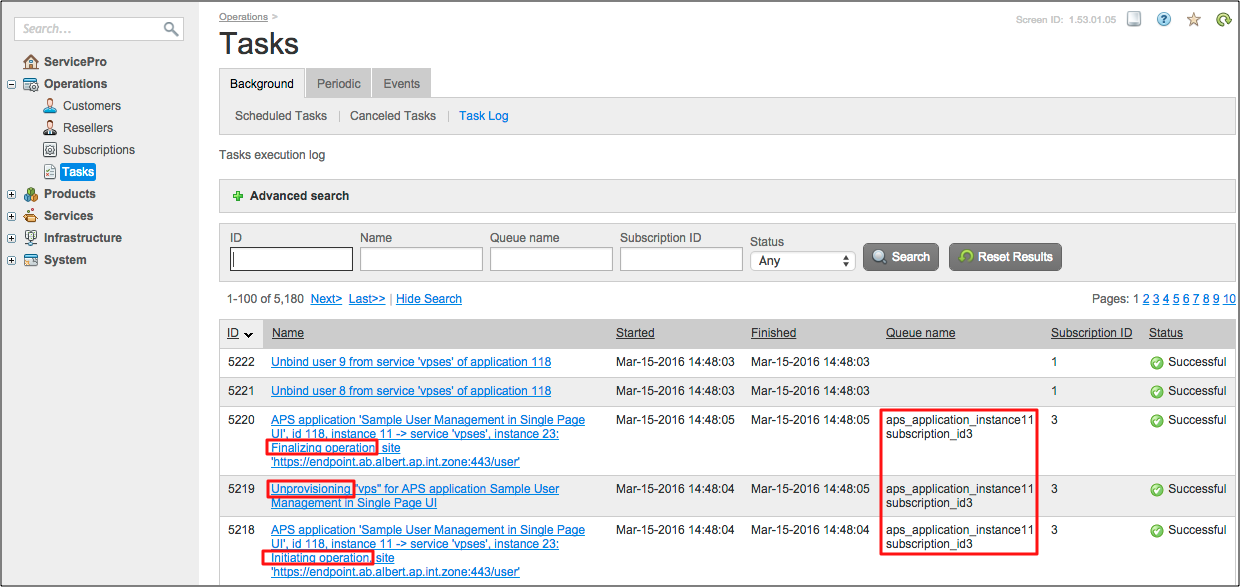
Tasks in the same queue, as in the above example, run sequentially starting with the lowest ID.
Note
APS task names start with the
aps_application_instanceprefix.Asynchronous operations of application services are implemented using special tasks as explained in Asynchronous Configuration and Asynchronous Provisioning.
The Periodic tab displays periodical tasks, and some of them support APS operations.
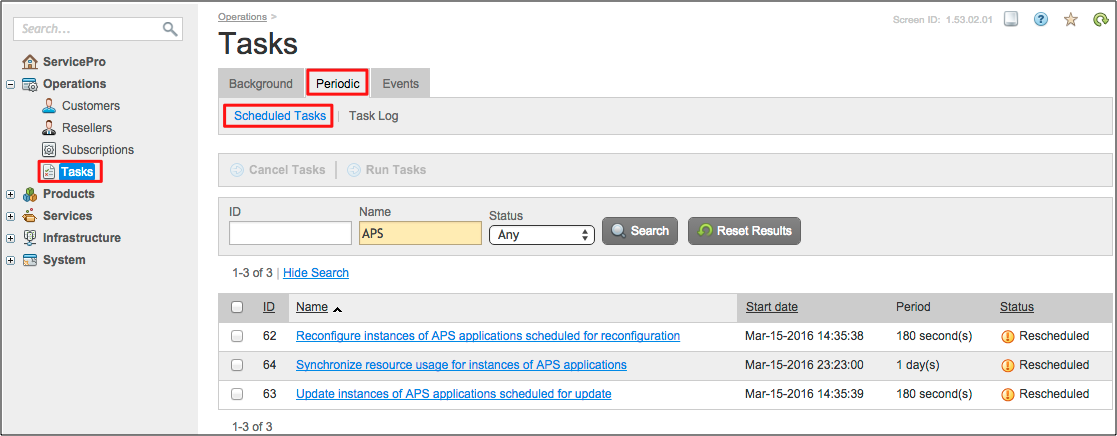
For example, running the Synchronize resource usage for instances of APS applications task updates the resource usage counters.
Logs
The management node contains the following logs for recording backend operations.
APSC REST Log (
/var/log/apsc.http.log): the APS controller REST log records all REST requests to and from the APS controller (APSC), including HTTP headers. If you increase the log level totrace, as explained below, the log will also record the body of each REST request.Platform UI Log (
/var/log/pa/pui/pui.log): the platform UI log records the user panel navigation activity. The log is particularly useful when the user panel is missing UI views, or the navigation from view to view does not function correctly.Management Node Log (
/var/log/pa/core.log): the management node log tracks system operations. While it is less common to use it for debugging APS applications, the APS support team may request this log to help with troubleshooting a support request.
The log level specified in /usr/local/pem/etc/pleskd.props defines the level of details recorded in
the above-mentioned logs, for example:
loglevel=trace
After changing the log level, restart the pa-agent service:
# systemctl restart pa-agent
The management node components, including the APS controller and UI service, support several log levels in increasing levels of detail:
error- only error messagesinfo- error and information messagesdebug- default; all details except for tracing of method callstrace- all details, including tracing of method calls
For example, use the following commands to set the trace log level:
# grep -q 'loglevel=trace' /usr/local/pem/etc/pleskd.props || echo 'loglevel=trace' >> /usr/local/pem/etc/pleskd.props
# systemctl restart pa-agent
Note
Due to the amount of information recorded, you should use the
tracelevel only temporary.
2. Use the info or error level when the management node experiences some issues with performance or
disk space; otherwise, you should use the default debug level.
APS Controller Log
Overview
The APS controller (APSC) is the APS bus broker, which means that all APS REST messages go through it. Therefore, the best
place to find all APS REST messages is the APS controller REST Log (/var/log/pa/apsc.http.log), where the APS controller
records all incoming and outgoing REST messages. As described above, the log level defines the level of
the recorded details.
An incoming request, marked as IN, usually invokes several other REST requests depending on the resource model and
the type of the operation as explained for
provisioning and configuration operations.
The REST requests invoked by an incoming request receive the same ID (for example, rest:895) to help you find
all the operations within one group.
Debug Level
By default, the log level is set to debug, which records all REST requests with the URL and headers.
In the following example, a customer uses UX1 to request a new VPS, which requires
several operations that the APS controller REST log records. In the following excerpts, the date-time prefix
is omitted for brevity.
After receiving the request for a new VPS from UX1, the APS controller starts a set of operations and assigns an ID (for example,
rest:895) to it:rest:895 IN 10.28.110.145:59511 Begin request: "POST /aps/2/resources/124a8f8c-9702-4e6d-bbc7-14842e5b07e6/vpses/"
The URI refers to the
vpsesrelation of the management context. When the log level is set todebug, the APS controller does not record the body of the request that contains the JSON representation of the new VPS.The request from the UX1 contains several headers:
rest:895  IN  Request headers: 'Origin:http://ab.isv1.apsdemo.org:8080'  'X-Requested-With:XMLHttpRequest'
'Accept:application/javascript, application/json'
'User-Agent:Mozilla/5.0 (Macintosh; Intel Mac OS X 10_7_4) AppleWebKit/537.36 (KHTML, like Gecko) Chrome/48.0.2564.116 Safari/537.36'
'Referer:http://ab.isv1.apsdemo.org:8080/aps/2/packages/341033f2-0828-4b18-9f0b-bba60797a49a/ui/bootstrapApp.html'
'Host:10.28.110.145:6308'  'Accept-Encoding:gzip, deflate'  'APS-Token:...WEwwPQ=='
'bw_id:b1552b6e5a5dd35ca05919c2c88b3b72'  'Accept-Language:en-US,en;q=0.8,ru;q=0.6'  'APS-Locale:en_US'
'Content-Type:application/json'  'X-Forwarded-For:10.24.37.184'  'Content-Length:246'  'Connection:Keep-Alive'
To fulfill the request from UX1, the APS controller sends its own requests, marked as
OUT, to the APS application instance to sync changes in the APS database with the external application. In our example, it starts by creating a link for the new VPS in thevpseslink collection on the management context resource.rest:895 OUT endpoint.ab.isv1.apsdemo.org Begin request: "POST /basic1p/contexts/124a8f8c-9702-4e6d-bbc7-14842e5b07e6/vpses"
The outgoing request from the APS controller contains the following headers:
rest:895  OUT  Request headers: 'APS-Application-ID:3641e96b-4ab4-4c00-8a45-b6f9d2a61fd0'  'Host:endpoint.ab.isv1.apsdemo.org'
'APS-Controller-URI:https://10.28.110.145:6308/'  'APS-Instance-ID:3641e96b-4ab4-4c00-8a45-b6f9d2a61fd0'
'X-Forwarded-For:10.24.37.184, 10.28.110.145'  'APS-Version:2.2.0'  'APS-Identity-ID:c4c61a6a-5df6-4fc4-b984-fbba527c098d'
'APS-Actor-ID:ec8b49ed-7da0-4de4-92e7-21cd7afc413b'  'APS-Transaction-ID:1604803675'  'Platform-Transaction-ID:1604803675'
The application returns a message with headers and the HTTP return code “204 No Content”, which is the normal response after creating a link:
rest:895  OUT  Response headers: 'Date:Wed, 16 Mar 2016 14:17:31 GMT'  'Server:Apache/2.4.6 (CentOS) OpenSSL/1.0.1e-fips PHP/5.4.16'
'X-Powered-By:PHP/5.4.16'  'Content-Length:0'  'Connection:close'  'Content-Type:text/html; charset=UTF-8'

rest:895  OUT  endpoint.ab.isv1.apsdemo.org  [880] "POST /basic1p/contexts/124a8f8c-9702-4e6d-bbc7-14842e5b07e6/vpses HTTP/1.1"
[0] "204 No Content"  105ms
The APS controller requires provisioning of the new VPS on the application side:
rest:895 OUT endpoint.ab.isv1.apsdemo.org Begin request: "POST /basic1p/vpses"
The request from the APS controller contains the following headers:
rest:895  OUT  Request headers: 'APS-Request-Phase:sync'  'Host:endpoint.ab.isv1.apsdemo.org'
'APS-Controller-URI:https://10.28.110.145:6308/'  'APS-Instance-ID:3641e96b-4ab4-4c00-8a45-b6f9d2a61fd0'
'X-Forwarded-For:10.24.37.184, 10.28.110.145'  'APS-Version:2.2.0'  'APS-Identity-ID:c4c61a6a-5df6-4fc4-b984-fbba527c098d'
'APS-Actor-ID:ec8b49ed-7da0-4de4-92e7-21cd7afc413b'  'APS-Transaction-ID:1604803675'  'Platform-Transaction-ID:1604803675'
The application returns a message with headers and the HTTP return code, “200 OK”, which means the application created the VPS:
rest:895  OUT  Response headers: 'Date:Wed, 16 Mar 2016 14:17:31 GMT'  'Server:Apache/2.4.6 (CentOS) OpenSSL/1.0.1e-fips PHP/5.4.16'
'X-Powered-By:APS PHP Runtime 2.2-153'  'Cache-Control:no-cache, must-revalidate'  'Expires:0'  'Content-Length:2'
'Connection:close'  'Content-Type:application/json'

rest:895  OUT  endpoint.ab.isv1.apsdemo.org  [880] "POST /basic1p/vpses HTTP/1.1"  [2] "200 OK"  35ms
The APS controller completes the set of operations by sending a response to UX1:
rest:895  IN  Response headers: 'Date:Wed, 16 Mar 2016 14:17:31 GMT'  'Connection:Keep-Alive'
'Content-Type:application/json' 'Expires:Mon, 01 Jan 2001 00:00:01 GMT'  'Cache-Control:no-cache, no-store'
'Content-Length:873'

rest:895  IN  10.28.110.145  [246] "POST /aps/2/resources/124a8f8c-9702-4e6d-bbc7-14842e5b07e6/vpses/ HTTP/1.1"
[873] "200 OK"  407ms
Trace Level
If the log level is set to trace, the log will record the entirety of each REST message including the body.
For example:
Mar 16 15:57:19.099 : rest:1010  IN  Response body: [1090] [
        {
                "aps":
                {
                        "type": "http://aps-standard.org/samples/suwizard1p/vps/1.1",
                        "id": "38146701-73ad-4807-a6c0-a828c5da42ec",
                        ...
                },
                ...
         },
         ...
]
Platform UI Log
The navigation engine processes the navigation elements created by the system and custom applications in the control panel. Each time that a user navigates to a view in the control panel, whether by clicking on an item in the navigation panel or by clicking on another control that navigates to another view, the navigation engine receives and processes the navigation request. It computes the whole navigation tree and returns a structure that helps the UX1 renderer present the tree and a view for the user.
The navigation activity is recorded in the platform UI Log (/var/log/pa/pui/pui.log) on the management node.
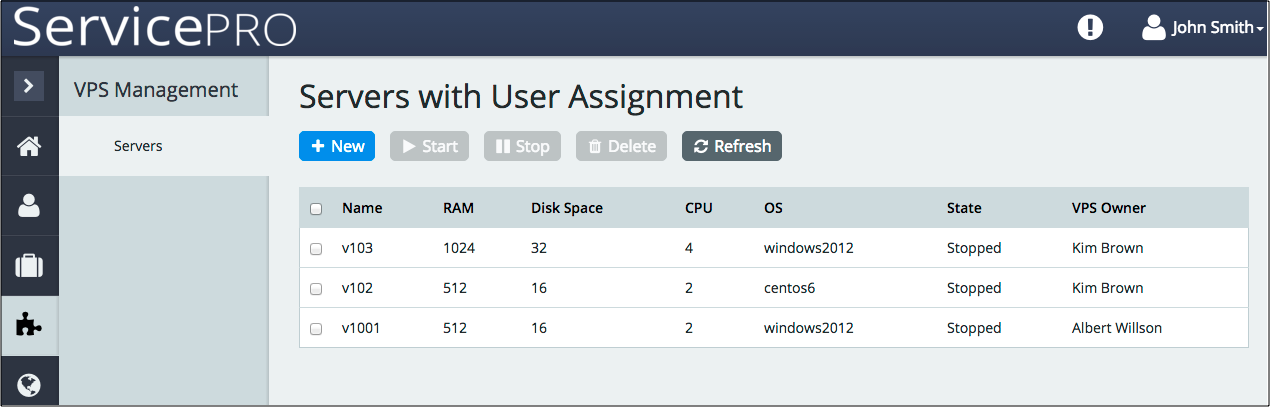
The following example includes excerpts from the log to show what happens when a customer clicks on the top-level VPS Management navigation item created by a custom application:
The navigation engine records the UI navigation process in the following log sections.
Pre-processing - After you click on a navigation item in the navigation panel, the control panel catches the click and invokes the
aps/2/navigationcall to the APS controller. The navigation engine intersects it and starts implementing and recording the pre-processing phase.For example, if the task ID is 142, the first line of this section looks as follows:
13:15:58.885 [default task-142] DEBUG c.p.p.c.c.p.filters.InjectionFilter - Injection filter request:/aps/2/navigation
Note
The task ID helps you find the records associated with the same task. In the following examples, the task ID is omitted for brevity.
In this section, you can find the sequence of actions done by various internal components of the pre-process phase:
Identification of the development mode
DEBUG com.plesk.p2.util.APS2Filter - get APS_DEVEL_MODE from SystemProperty
Getting session ID
Displaying the POST request URL and HTTP headers
Core processing - This section contains the following activities:
It starts with the request for navigation hierarchy. The input parameters of the request consist of the
placeholderID, the ID of the target navigation tree, and other parameters as presented here:DEBUG com.tbn.app.NavApi - REQUEST: { "placeholder":"http://www.parallels.com/ccp/2", "context":[], "parameters":{}, "locale":"en_US", "itemId":"http://aps-standard.org/samples/suwizard1p#ccp" }The navigation engine computes the declared variables, for example, it gets the management
contextvariable declared in metadata:DEBUG com.tbn.app.APSC - 10 ms [ GET /resources?implementing(http%3A%2F%2Faps-standard.org%2Fsamples%2Fsuwizard1p%2Fcontext%2F1.0) ] DEBUG com.tbn.VarResolver - context:{ "aps":{ "type":"http://aps-standard.org/samples/suwizard1p/context/1.0", "id":"1e7bb257-a4c7-443d-ab54-db13b3239766", "status":"aps:ready", "revision":4, "modified":"2016-03-04T11:17:28Z", "subscription":"025c110f-e58d-4f70-a2e2-44ead5a10da4" }}The navigation engine identifies all packages involved into the building of the navigation tree.
It reads metadata from the respective
APP-META.xmlfiles.The section finishes with the building of the navigation hierarchy, for example:
DEBUG com.tbn.app.NavApi - RESPONSE: {
    "context":[
       {"viewId":"http://aps-standard.org/samples/suwizard1p#servers","viewLabel":"Servers with User Assignment"}
    ],
    "items":[
       {
          "id":"http://www.parallels.com/ccp-dashboard#home-navigation",
          "label":"Home",
          "type":"navigation"
       },
       {
          "id":"http://www.parallels.com/ccp-users#usersapp-navigation",
          "label":"Users",
          "type":"navigation"
       },
       {
          "children":[
             {"id":"http://www.parallels.com/ccp-users#view-account","label":"Account Profile","type":"item"},
             {"id":"http://www.parallels.com/ccp-users#view-notifications","label":"Action Log","type":"item"}
          ],
          "id":"http://www.parallels.com/ccp-users#accountapp-navigation",
          "label":"Account",
          "type":"navigation"
       },
       {"children":[
          {"children":[{
                "vars":{
                   "context":{
                      "aps":{
                         "type":"http://aps-standard.org/samples/suwizard1p/context/1.0",
                         "id":"1e7bb257-a4c7-443d-ab54-db13b3239766",
                         "status":"aps:ready",
                         "revision":"4",
                         "modified":"2016-03-04T11:17:28Z",
                         "subscription":"025c110f-e58d-4f70-a2e2-44ead5a10da4"
                      }
                   }
                },
                "id":"http://aps-standard.org/samples/suwizard1p#servers",
                "maximized":"false",
                "label":"Servers with User Assignment",
                "type":"view",
                "src":"/aps/2/packages/4cca20f6-cb2e-43ff-a9a6-2b93c1a2d1dc/ui/servers.js"
          }],
          "id":"http://aps-standard.org/samples/suwizard1p#servers",
          "label":"Servers","type":"item"
       }],
       "id":"http://aps-standard.org/samples/suwizard1p#ccp",
       "label":"VPS Management","type":"navigation"},
       {
          "id":"http://www.parallels.com/ccp-domains#domainsapp-navigation",
          "label":"Domains",
          "type":"navigation"
       }
    ]
}
The structure contains all top-level navigation items, and it goes down to the currently selected view, which in the above example is the one marked as
"id":"http://aps-standard.org/samples/suwizard1p#servers".
Note
The log records the time required for completing each operation, and it records the total time:
DEBUG com.tbn.app.NavApi - 506 ms [NavApi.handleNavigation]
Post-processing - This section records that the web session with the current user is completed. The final record is:
DEBUG c.p.p.c.c.p.filters.InjectionFilter - Injection filter request processed
Management Node Log
The management node log records the internal activity of that node.
It is of primary use to the provider’s support team to help troubleshoot platform issues
down to low-level methods and SQL statements. If an APS support task does not function correctly,
it is possible to find the APS-related records (for example, by seeking for the aps_application_instance prefix
or another APS-related pattern). This section does not cover the specifics of this log.
Package Location
When you import an APS package into the management node, the latter unpacks it and places
into the /usr/local/pem/APS/packages/ folder. If the latest package you have imported was
Sample_Basic_Single_Page-1.0-0.app.zip, the following command will show the package sub-folder
on top of the output:
# ls -lt /usr/local/pem/APS/packages

drwxr-xr-x  7 pemuser pemgroup     4096 Mar 16 17:08 341033f2-0828-4b18-9f0b-bba60797a49a
-rw-r--r--  1 pemuser pemgroup    14844 Mar 16 17:08 341033f2-0828-4b18-9f0b-bba60797a49a.zip
-rw-r--r--  1 root    root        14844 Mar 16 17:08 Sample Basic Single Page-1.0-0.app.zip
... the rest of the output is cut off for brevity
The folder name is the same as the APS ID assigned to the imported package. When you find the package location, you can update files directly on the server.
Note
Although the files in the scripts/ sub-folder are also inside the package folder,
there is no need to update them here. They are functioning on the endpoint host.
Warning
Do not update files on the server directly in a production system. Instead, always follow the application update process.
REST Requests in the Command Line
The command line interface (CLI) allows you to send REST requests to your APS application instance directly on behalf of the APS controller. You will need root access to the management node.
Before you can send a request, you need the following data:
APSC SSL Certificate - To send packages on behalf of the controller, you must first locate the APSC’s SSL certificate on the management node (
/usr/local/pem/APS/certificates/controller.pem).APS application instance ID - Each APS application instance certificate uses the APS application instance ID as the file name (without an extension). To find the ID, list the contents of the
<app-endpoint>/config/folder on the endpoint host, for example, it can be/var/www/html/basic-app/config/.APS Resource ID - To perform an operation over a certain resource, find the APS ID of the resource. You can get it by sending a preliminary GET request to the APS controller using a REST client.
The following example demonstrates a call to the vpses service to change the state of the specified VPS:
# curl -k -X GET -H 'APS-Controller-URI:https://10.28.127.243:6308/' \
   -H 'APS-Instance-ID: 57e6af16-1e81-4bd9-91dc-d8b6b452e61c' \
   -E /usr/local/pem/APS/certificates/controller.pem \
   https://<app-endpoint>/vpses/38146701-73ad-4807-a6c0-a828c5da42ec/start
https://<app-endpoint>/.You can also send REST requests on behalf of other actors, either in the command line or in a browser.