Table Of Contents
Application Packaging Standard
Last updated 18-Mar-2019PHP Debugger
The PHP debugger embedded into IDE allows you to debug PHP scripts on the application backend (provisioning scripts). For this purpose, the IDE must have an open TCP port to accept external connections from the APS application instance. If the default port 9000 is busy on your local computer, set another free TCP port:
Open the PhpStorm preferences and navigate to Languages & Frameworks > PHP > Debug.
In the Xdebug section, set the needed Debug port.
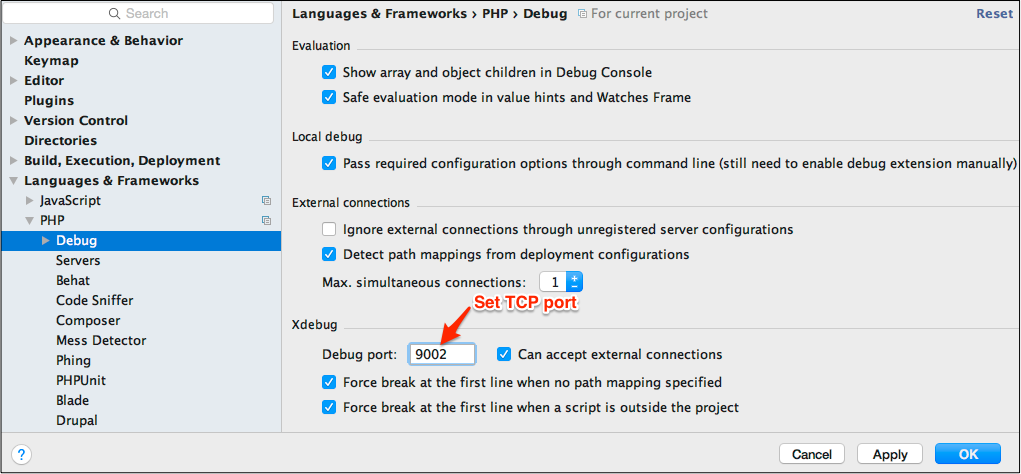
Click OK to save the configuration.
Run the new deployment or update an existing deployed package on the deployment target.
The debugging process looks as follows.
Ensure the package is deployed on a deployment target and on the endpoint host, that is the Deploy end-point on selected deployment target option was selected. Also, ensure the debug configuration is running.
Application resources can be provisioned or not depending on the provisioning operation you are debugging. For example, if the provisioning logic fails to install even an application instance, then there are no application resources yet and you have to debug the corresponding script responsible for it.
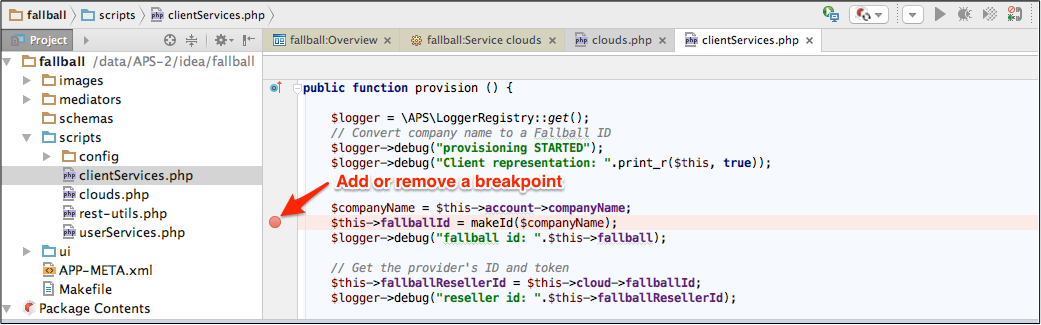
In IDE, open the respective PHP script and set debug breakboints there. To set a breakpoint on a line, click on the sidebar opposite this line.
Sync the package update with the deployment target.
Run the operation you are going to debug. For example, open the control panel on the deployment target and start provisioning or unprovisioning of a resource.
The provisioning PHP script must stop on the breakpoint as in this example:
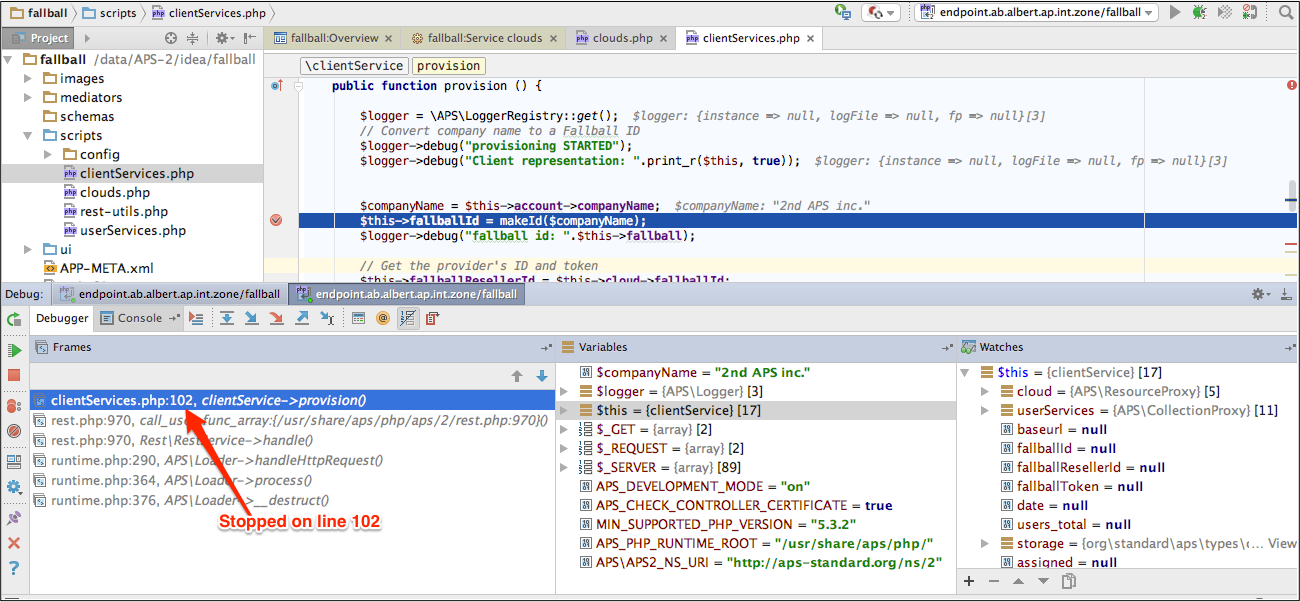
This allows you to continue with typical debug steps.