CloudBlue Commerce API (DRAFT)
Table Of Contents
Client Side
In this document:
Client Tools
A browser is a universal client used by all users working with the platform and the integrated applications. For testing and debugging, you will most probably need development tools, also known as debugging tools, plugged into your browser. Sometimes, it is necessary to send a direct REST request to the APS controller. For this purpose, use a REST client as explained in Using APS REST API.
Debugging Tools in Browser
Follow the recommendations on activating the debugging tools on your browser. The examples in this document are based on using the Chrome browser and its embedded Chrome DevTools.
To disable cache in Chrome:
In the browser, open Developer Tools.
In the Developer Tools screen, open Settings.
Tick the Disable cache (while DevTools is Open) checkbox.
Close Developer Tools.
If you experience some issues with custom UI in a console, activate the development tools.
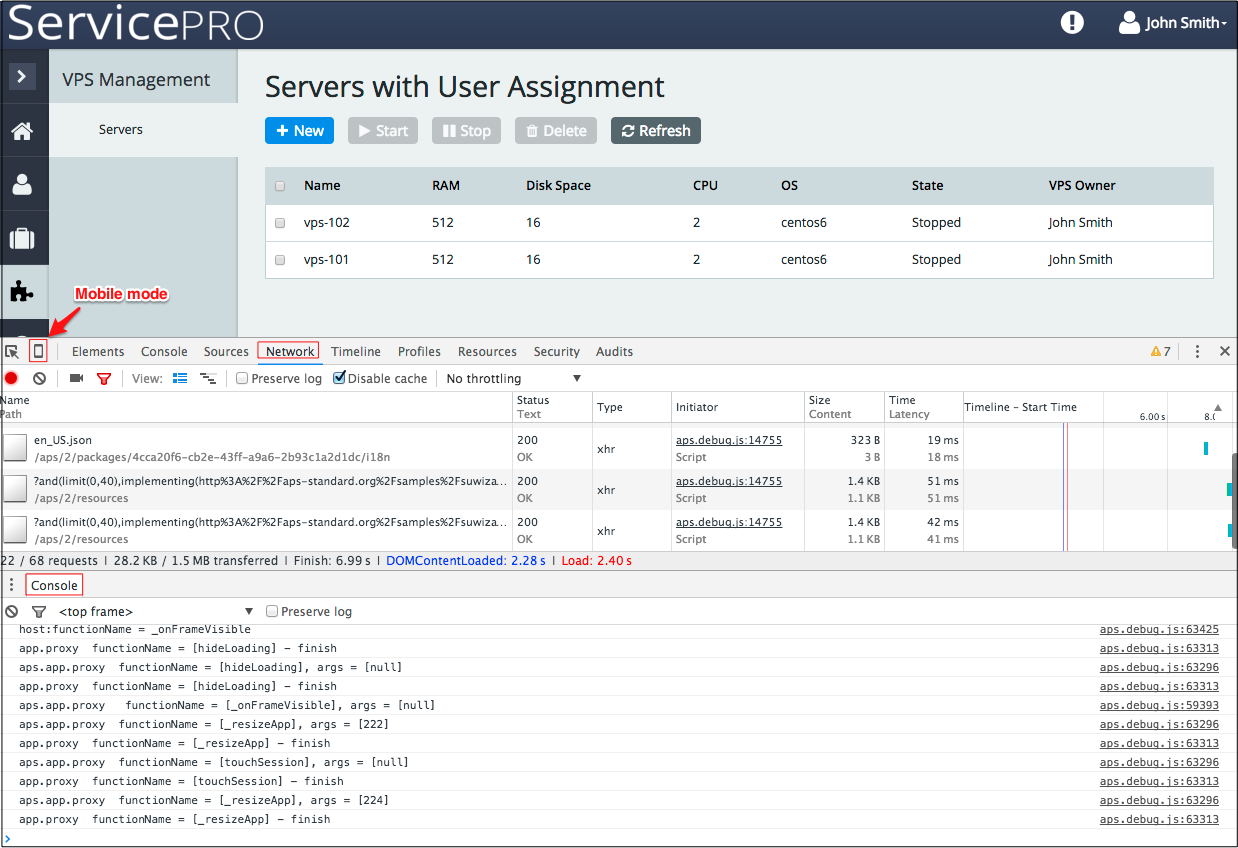
Typically, a developer uses the following tools:
Console tab - to find error messages and your custom messages, as well as to run commands on the fly
Network tab - to check REST requests and analyze them
Elements tab - to view the HTML code and change element on the fly
Source tab - to view HTML and JavaScript source code, set breakpoints, and analyze data on the fly
Mobile switch - to switch to the mobile mode in order to verify how the UI will look on mobile screens
Console Log Methods
You can print out some data in the debugger console using the following methods in JavaScript.
Print out strings or integers using a set of console log commands. You can differentiate them by severity as explained in Dojo debugging tutorial .
console.log("For your information");               // The method is used most often
console.debug("To make sure nothing happened");
console.info("Something might happen");
console.warn("Something happened, but it's not a big deal");
console.error("It's a real problem!");             // You have to fix the problem ASAP
Print more complex contents, like objects and arrays, using the
console.dir()function as explained in Dojo debugging tutorial :console.dir([ {attribute: "last_name", sortDescending: true}, {fruits: ["apple", "orange", "pear"], sortDescending: true} ]);
Use
console.group(),console.groupCollapsed(), andconsole.groupEnd()to collect messages printed by console log commands into a folder or a hierarchy of folders for your convenience as explained in Diagnose and Log to Console .var user = "jsmith", authenticated = true, authorized = true; // Start top-level group console.group("Authenticating user '%s'", user); if (authenticated) { console.log("User '%s' was authenticated", user); // Start nested group console.group("Authorizing user '%s'", user); if (authorized) { console.log("User '%s' was authorized.", user); } // End nested group console.groupEnd(); } // End top-level group console.groupEnd();
Breakpoints, Data Watch, and Console Commands
In the debugger window, you can set breakpoints in the JavaScript code. At each breakpoint, the debugger will stop JavaScript execution and let you examine necessary values:
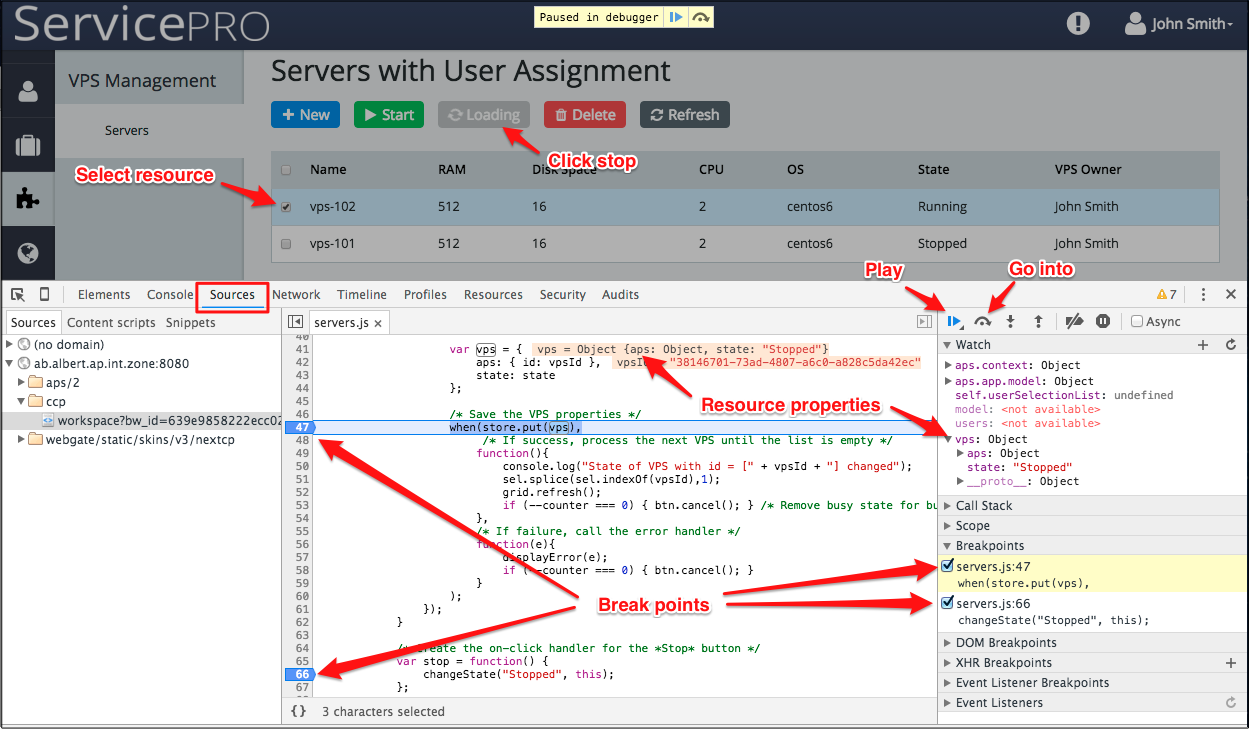
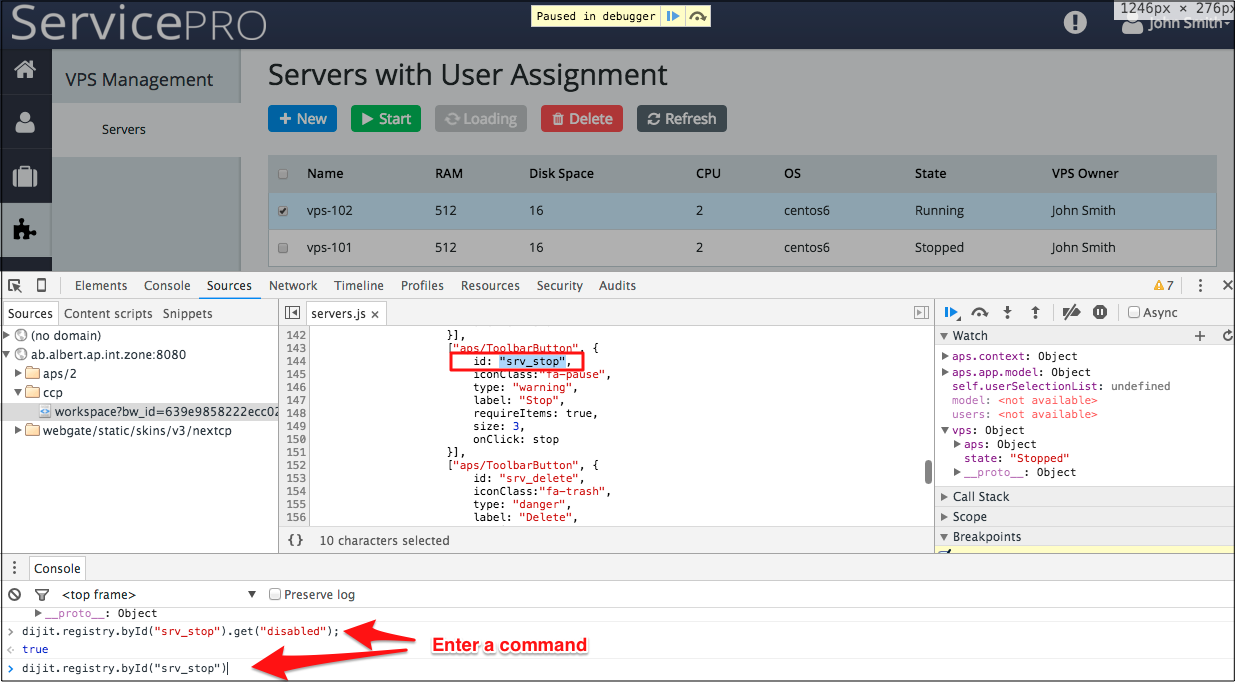
While the code is stopped by the debugger, you can run some commands in the console, for example, to check a widget property or a whole widget:
After examining the code and values, you can resume the execution of code, typically with a play button.
You can also use the legal JavaScript debugger; statement.
It has effect only when the debugger (for example Chrome DevTools) is active.
In this case, it stops the code execution the same way as you did by means of a breaking point set by the debugger UI tool.
debugger;
this.domNode.style.width = dojo.newWidth;
The advantage of this method is that breakpoints are set before the view is opened in the browser, whereas in the debugger UI you can do it only after the view is opened at least once.